XY Area Chart
JFreeChart is a free and pure java chart library for
creating professional quality charts.
This requires the libraries
jfreechart-1.0.13.jar and
jcommon-1.0.8.jar
to be in classpath.
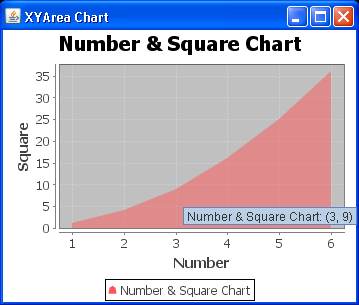
The following example shows creating a simple XY area chart.
package com.bethecoder.tutorials.jfree_charts.tests; import org.jfree.chart.ChartFactory; import org.jfree.chart.ChartFrame; import org.jfree.chart.JFreeChart; import org.jfree.chart.plot.PlotOrientation; import org.jfree.data.xy.XYDataset; import org.jfree.data.xy.XYSeries; import org.jfree.data.xy.XYSeriesCollection; public class XYAreaChart { public static void main ( String arg []) { // Prepare the data set XYSeries xySeries = new XYSeries ( "Number & Square Chart" ) ; xySeries.add ( 1 , 1 ) ; xySeries.add ( 2 , 4 ) ; xySeries.add ( 3 , 9 ) ; xySeries.add ( 4 , 16 ) ; xySeries.add ( 5 , 25 ) ; xySeries.add ( 6 , 36 ) ; XYDataset xyDataset = new XYSeriesCollection ( xySeries ) ; //Create the chart JFreeChart chart = ChartFactory.createXYAreaChart ( "Number & Square Chart" , "Number" , "Square" , xyDataset, PlotOrientation.VERTICAL, true, true, false ) ; //Render the frame ChartFrame chartFrame = new ChartFrame ( "XYArea Chart" , chart ) ; chartFrame.setVisible ( true ) ; chartFrame.setSize ( 300 , 300 ) ; } }